Dashboard and reports
The Dashboard shows at a glance whether everything works; the Reports page shows what the coupons brought.
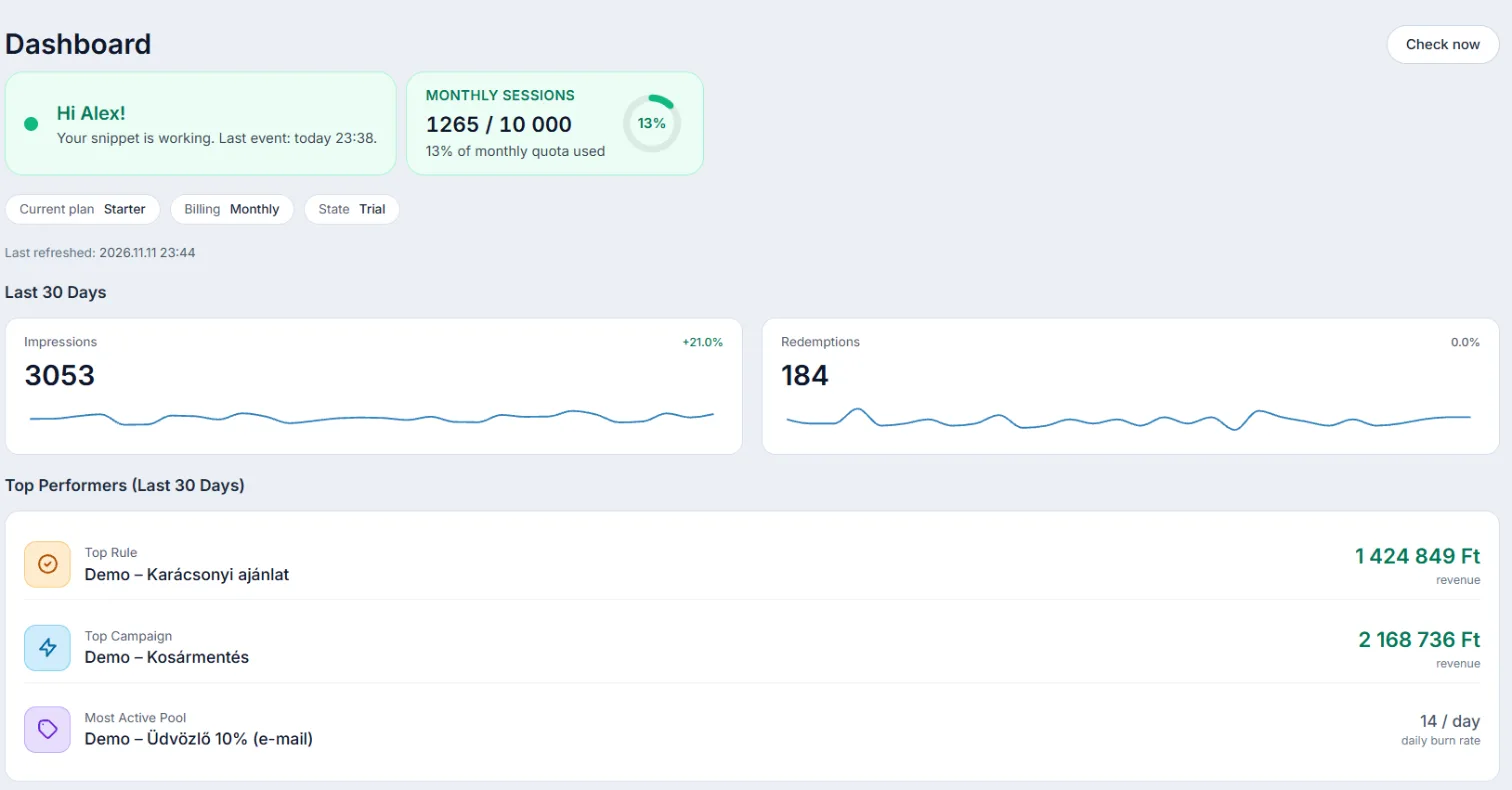
Dashboard
- Whether your snippet is working and when the last event came from your store.
- Monthly sessions: how much of the monthly visitor limit is used.
- Your current plan, billing interval and state.
- Impressions and redemptions of the last 30 days, the top rule, campaign and pool.
Reports
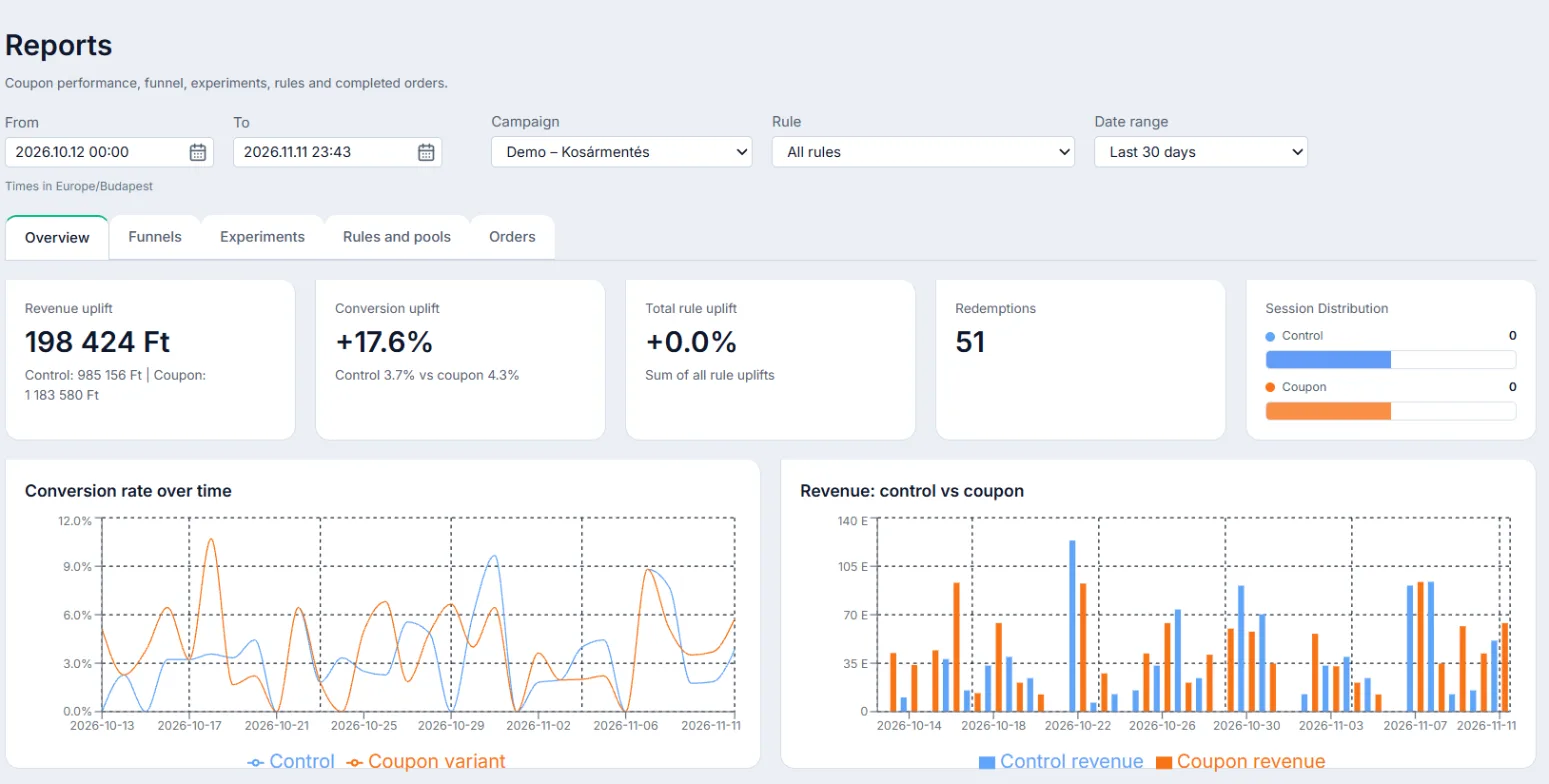
At the top filter by period (From, To, Date range), Campaign and Rule. The tabs:
- Overview: Revenue uplift, Conversion uplift, redemptions, and daily charts of the coupon and the control group.
- Funnels: from impression to redemption.
- Experiments: A/B test and variant results.
- Rules and pools: which rules and pools perform best.
- Orders: completed orders placed with a coupon.
How we count
- Daily buckets and “this month” use your shop’s time zone (Tenant settings).
- Revenue and conversion uplift are measured against the no-coupon control group: switch on a control group in the rule.
- Events reach the reports about a minute later.